Dynamically identifies strong Support and Resistance levels.
Detects bullish and bearish breakouts, continuation and end of trend phases.
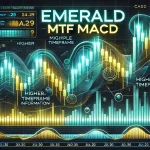
Higher time frame momentum, trend and stochastic direction.
All working together to easily identify high probability set ups.
Utilizes the MACD, Stochastic, SMI, TDI, CCI, Bollinger Bands and Divergences with Mutli-Timeframe filtering into a single, highly customizable solution for entering trades.
Tracks the market cycles via SMA and Stochastics. Provides momentum clarity by comparing the rate of change in momentum and rate of change on price to produce a composite score which is the plotted in a panel.